Vals AI — Research in motion

Vals AI — Research in motion

A visual language for AI research, from motion to editorial and social graphics.

A visual language for AI research, from motion to editorial and social graphics.

Visual design · Motion · Design exercise · 2026

Single-agent and coordinated paths. A conceptual illustration, not a plot of benchmark results.

01 / Agent teams

Do Agent Teams Pay Off? A Case Study on Vibe Code Bench

Do Agent Teams Pay Off? A Case Study on Vibe Code Bench

Main idea

The study asks when delegating work to a team of agents is worth the extra cost and coordination.

How the illustration expresses it

A direct path and a branching route lead toward the same objective. The contrast shows individual and coordinated work.

Blog placement
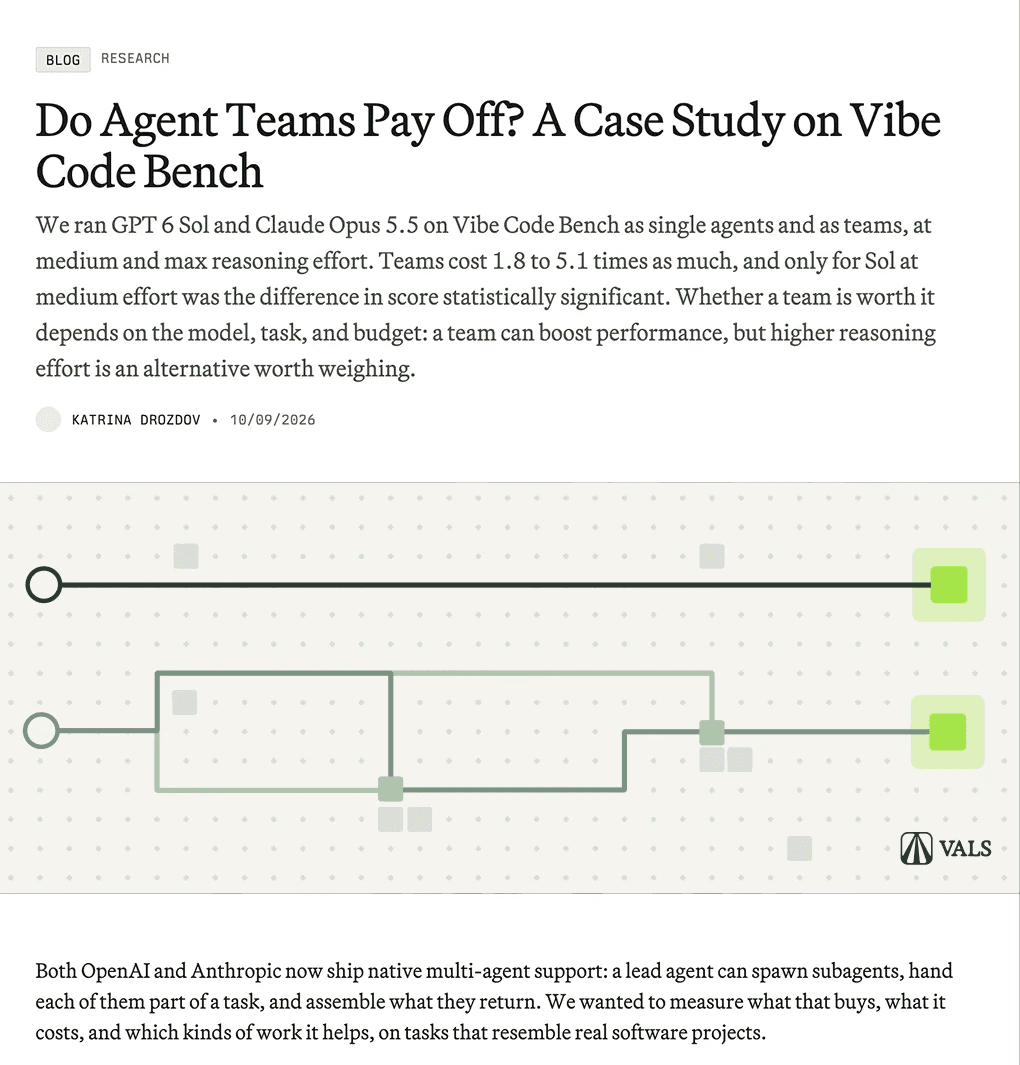
Agent-team artwork shown in the Vals AI blog layout

Social graphic

Agent-team social mockup

02 / Model routing

Routers Are a New AI Primitive

Routers Are a New AI Primitive

Modular forms representing model fit and task profile

Main idea

Routing is about choosing which model should handle a task, weighing quality, cost and latency.

How the illustration expresses it

Two modular forms represent the model and the task. Their complementary shapes make the question of fit visible.

Blog placement
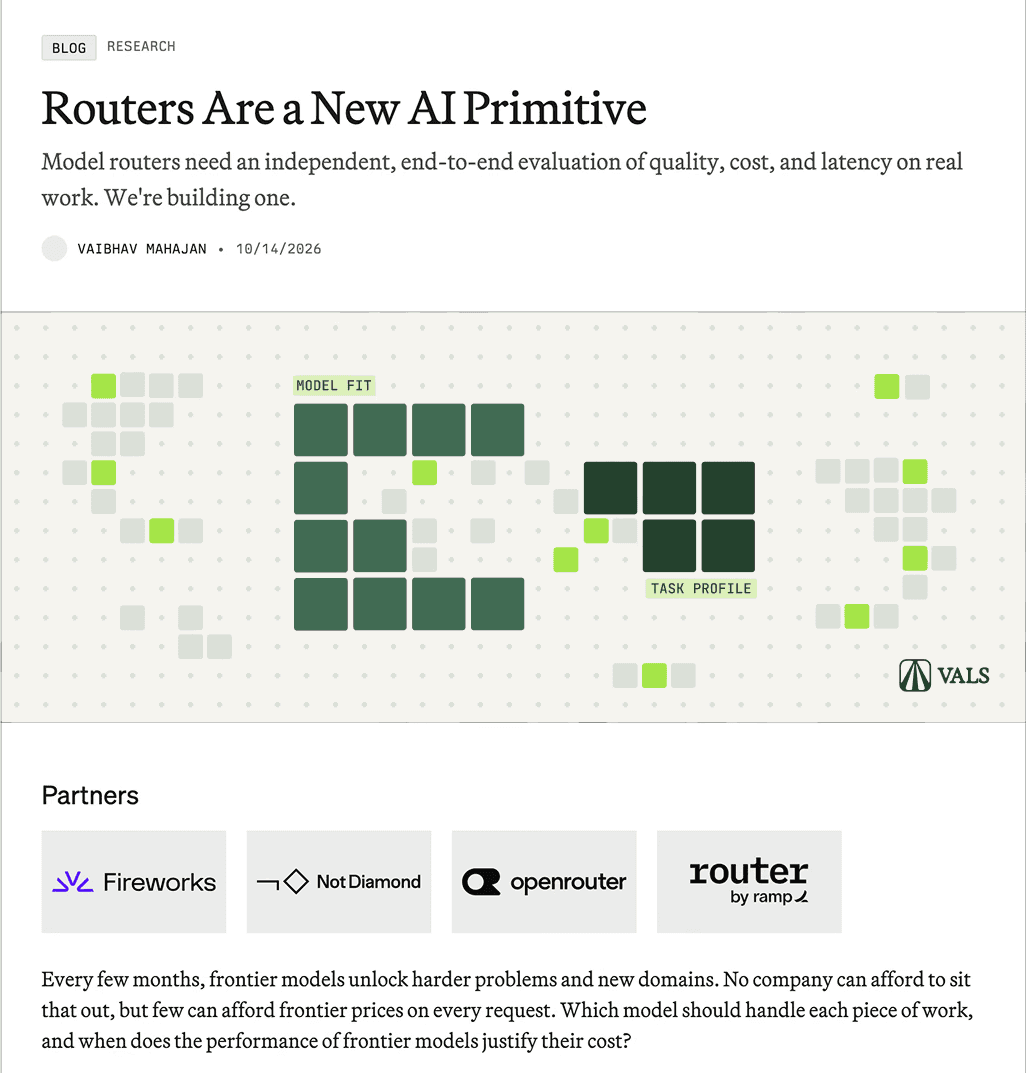
Agent-team artwork shown in the Vals AI blog layout

Social graphic

Agent-team social mockup

Approach and key decisions

Approach and key decisions

  • Visual inspiration: Identified recurring patterns and colors in Vals' existing data visualizations.

  • Grid system: Represents structure, evaluation, and data organization.

  • Geometric shapes: Rounded squares and rectangles represent agents, tasks, states, and outputs.

  • Purposeful design: Every shape and visual element serves a purpose, either reinforcing the central theme or adding meaning rather than acting as decoration.

  • Three rectangular sizes: Create hierarchy, flexibility, and variation.

  • Color palette: Core greens drawn from Vals' identity, with accent colors for future applications.

  • Scalability: A consistent, recognizable visual language that adapts across blog graphics, social posts, and research campaigns.

  • Visual inspiration: Identified recurring patterns and colors in Vals’ existing data visualizations.

  • Grid system: Represents structure, evaluation, and data organization.

  • Geometric shapes: Rounded squares and rectangles represent agents, tasks, states, and outputs.

  • Purposeful design: Every shape and visual element serves a purpose, either reinforcing the central theme or adding meaning rather than acting as decoration.

  • Three rectangular sizes: Create hierarchy, flexibility, and variation.

  • Color palette: Core greens drawn from Vals’ identity, with accent colors for future applications.

  • Scalability: A consistent, recognizable visual language that adapts across blog graphics, social posts, and research campaigns.